Portfolio
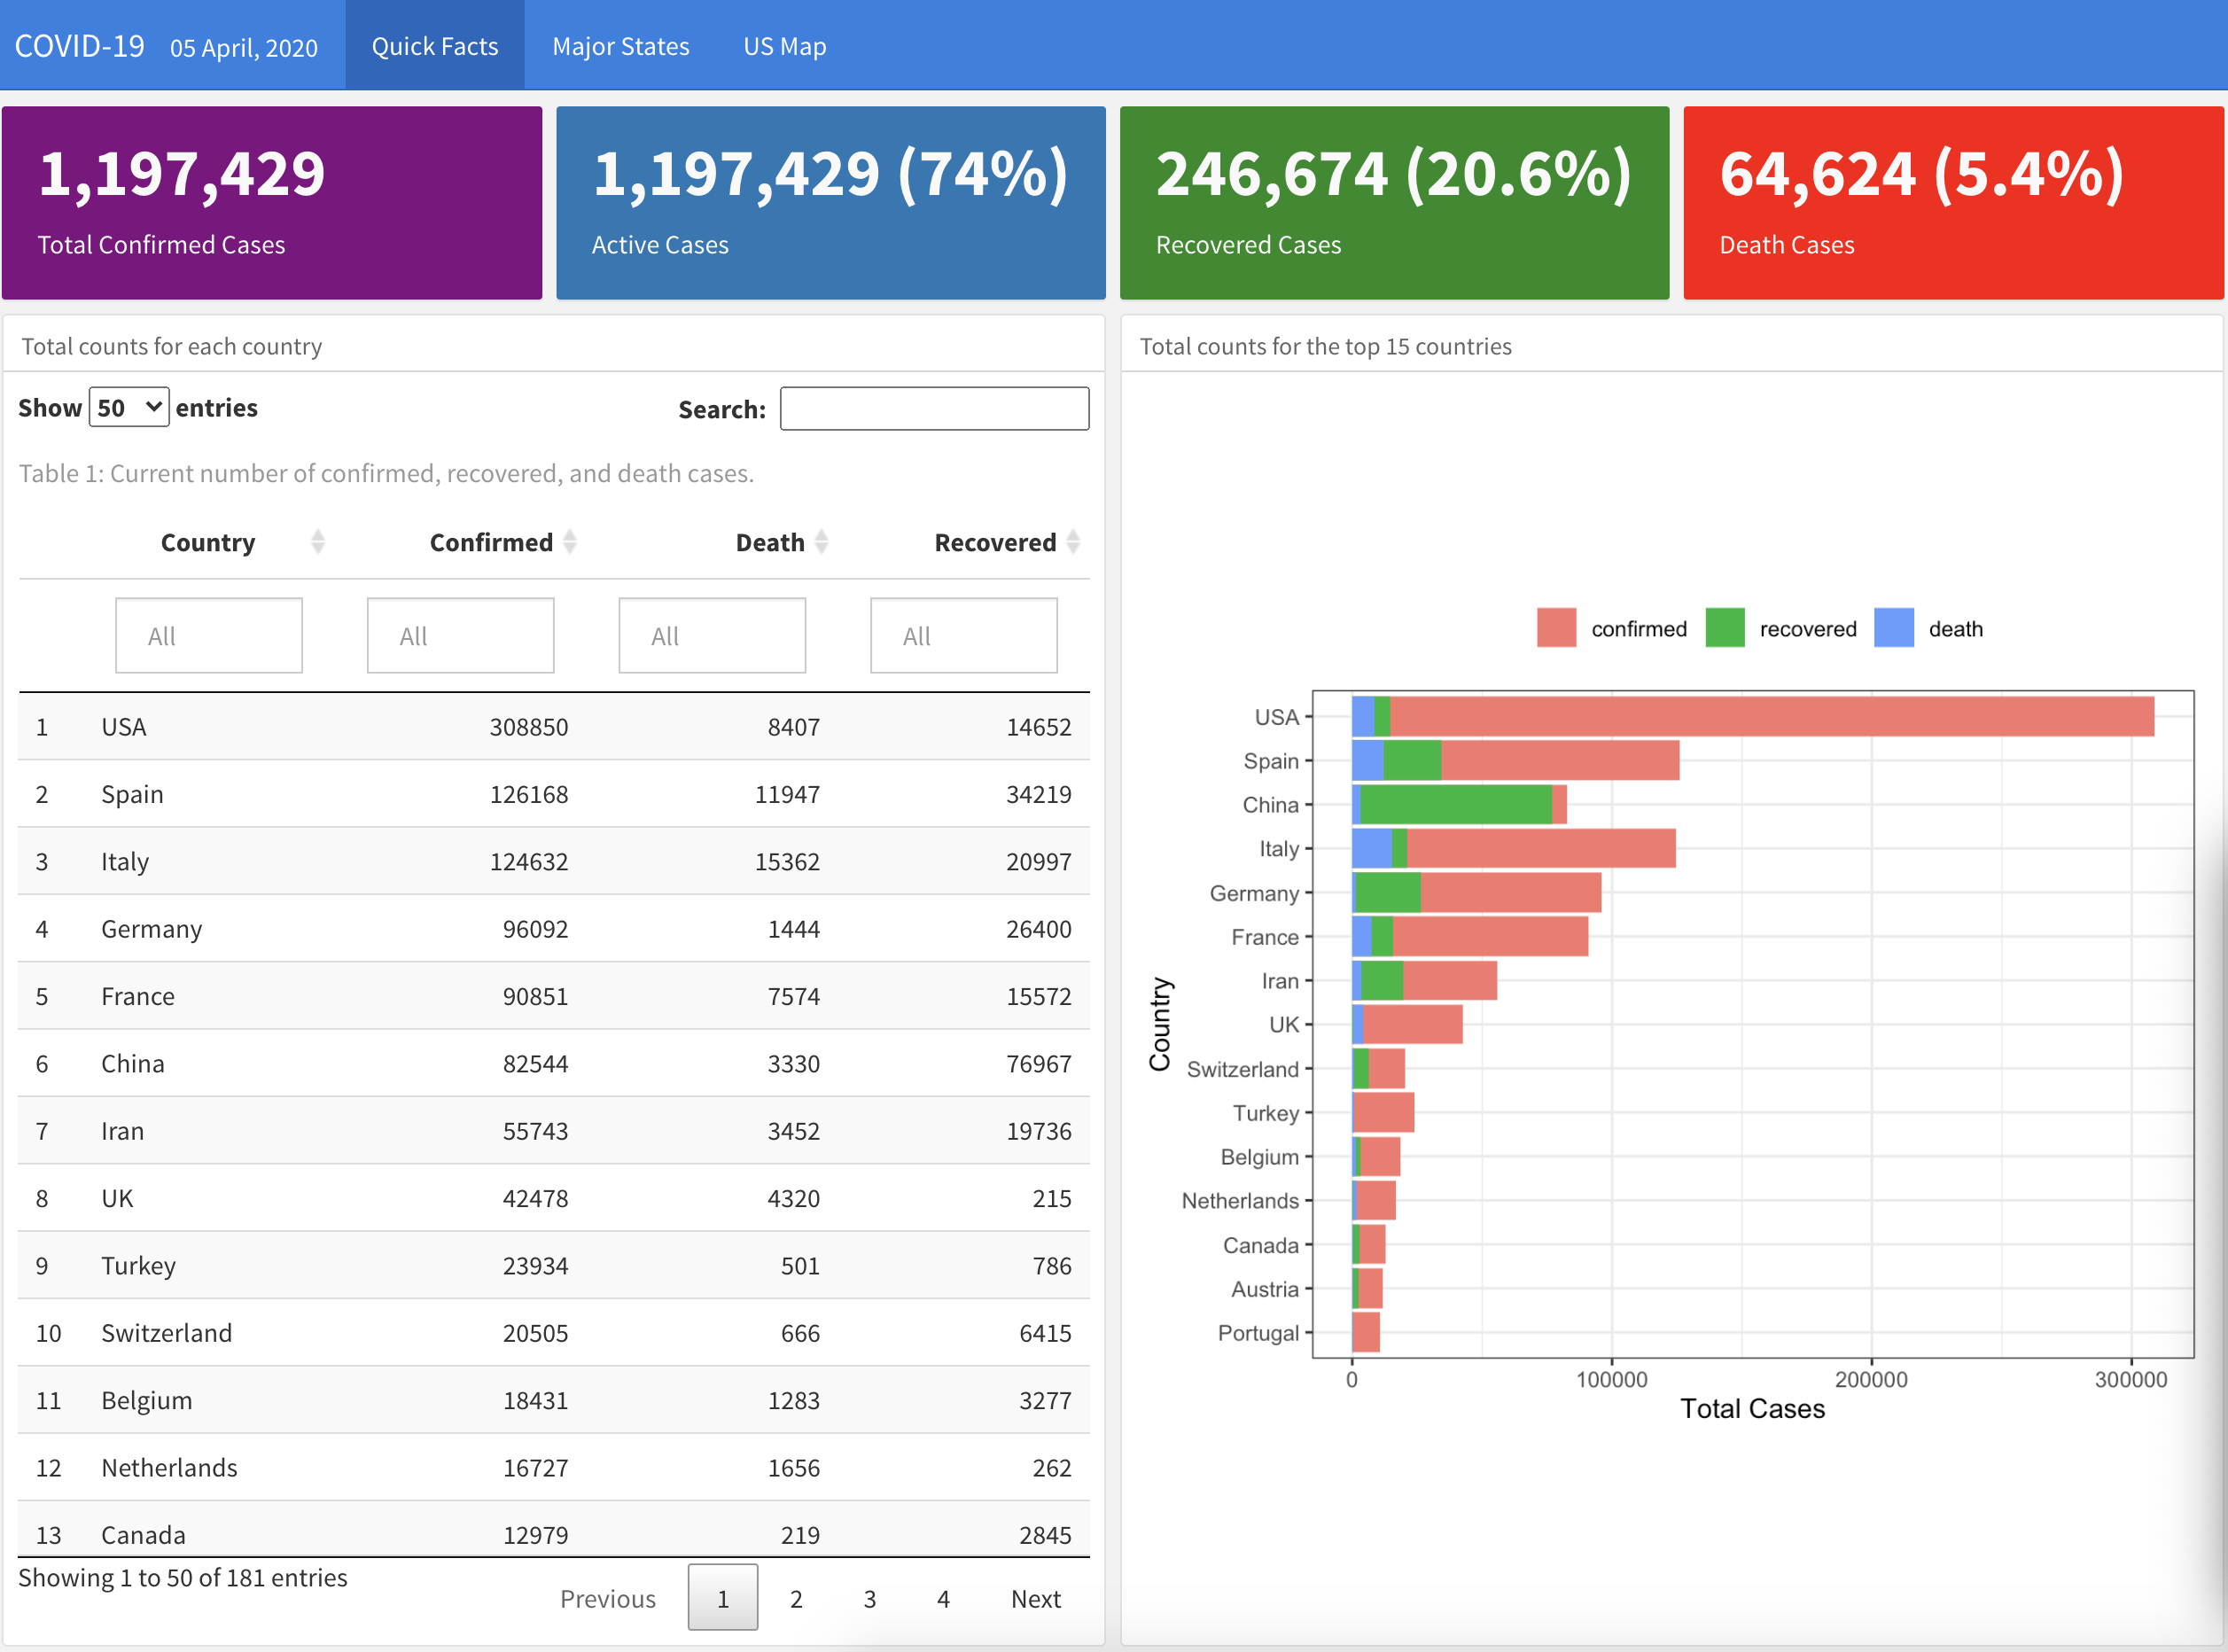
Project 1: Data Visualization of COVID
Dashboard: link
- Processed the COVID structured data (incl. data quality check) using dplyr
- Created plots with ggplot2 and plotly to show the trends over time
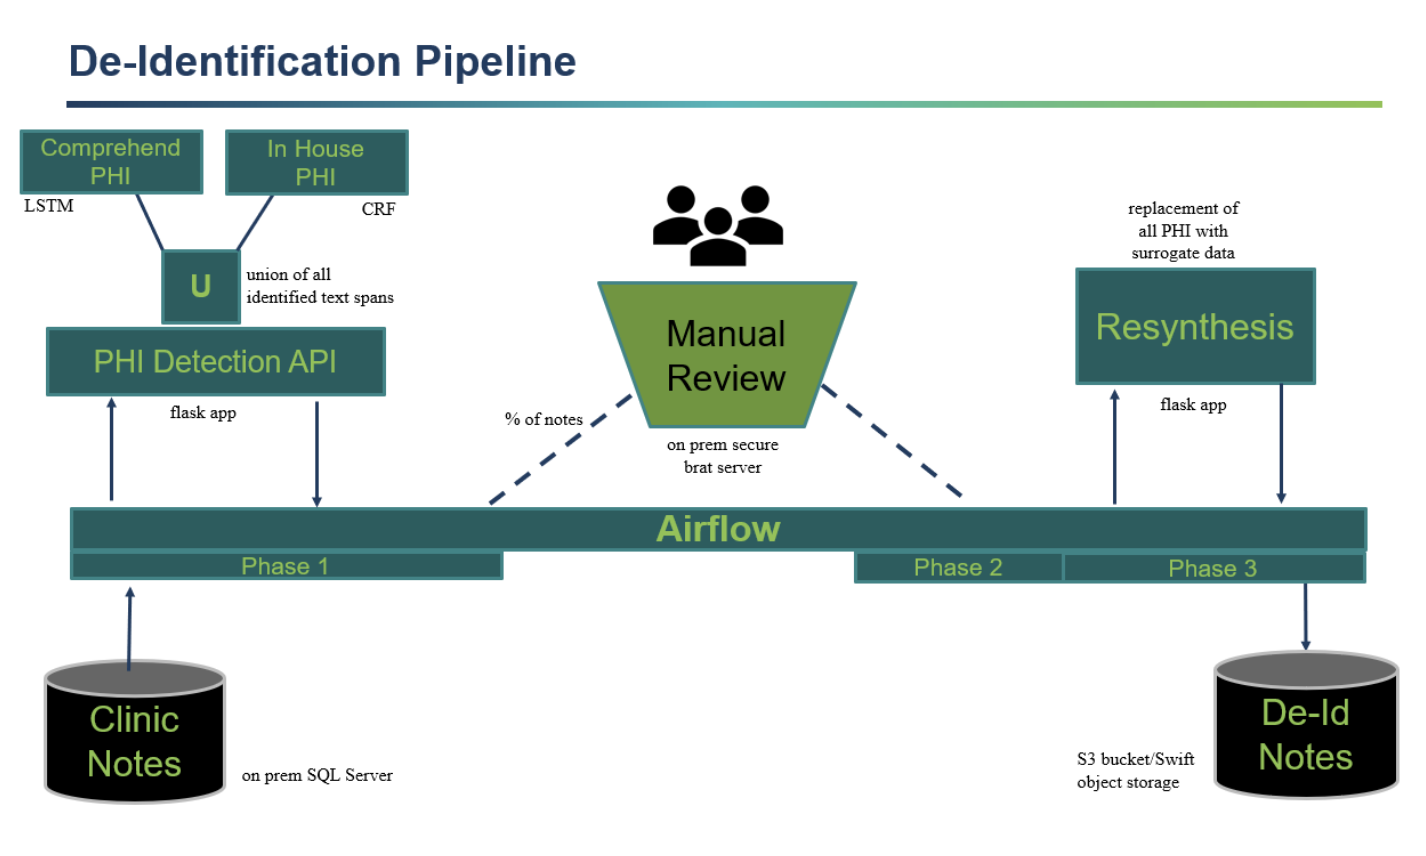
Project 2: De-Identification Pipeline wiki
- Pull notes from the server and identify personal health information (PHI) using Name Entity Recognition algorithms.
- Check notes and determine the notes for manual review.
- Developed resynthesis algorithm used for replacing identifiers (name, address, etc) with surrogates back into the raw text.
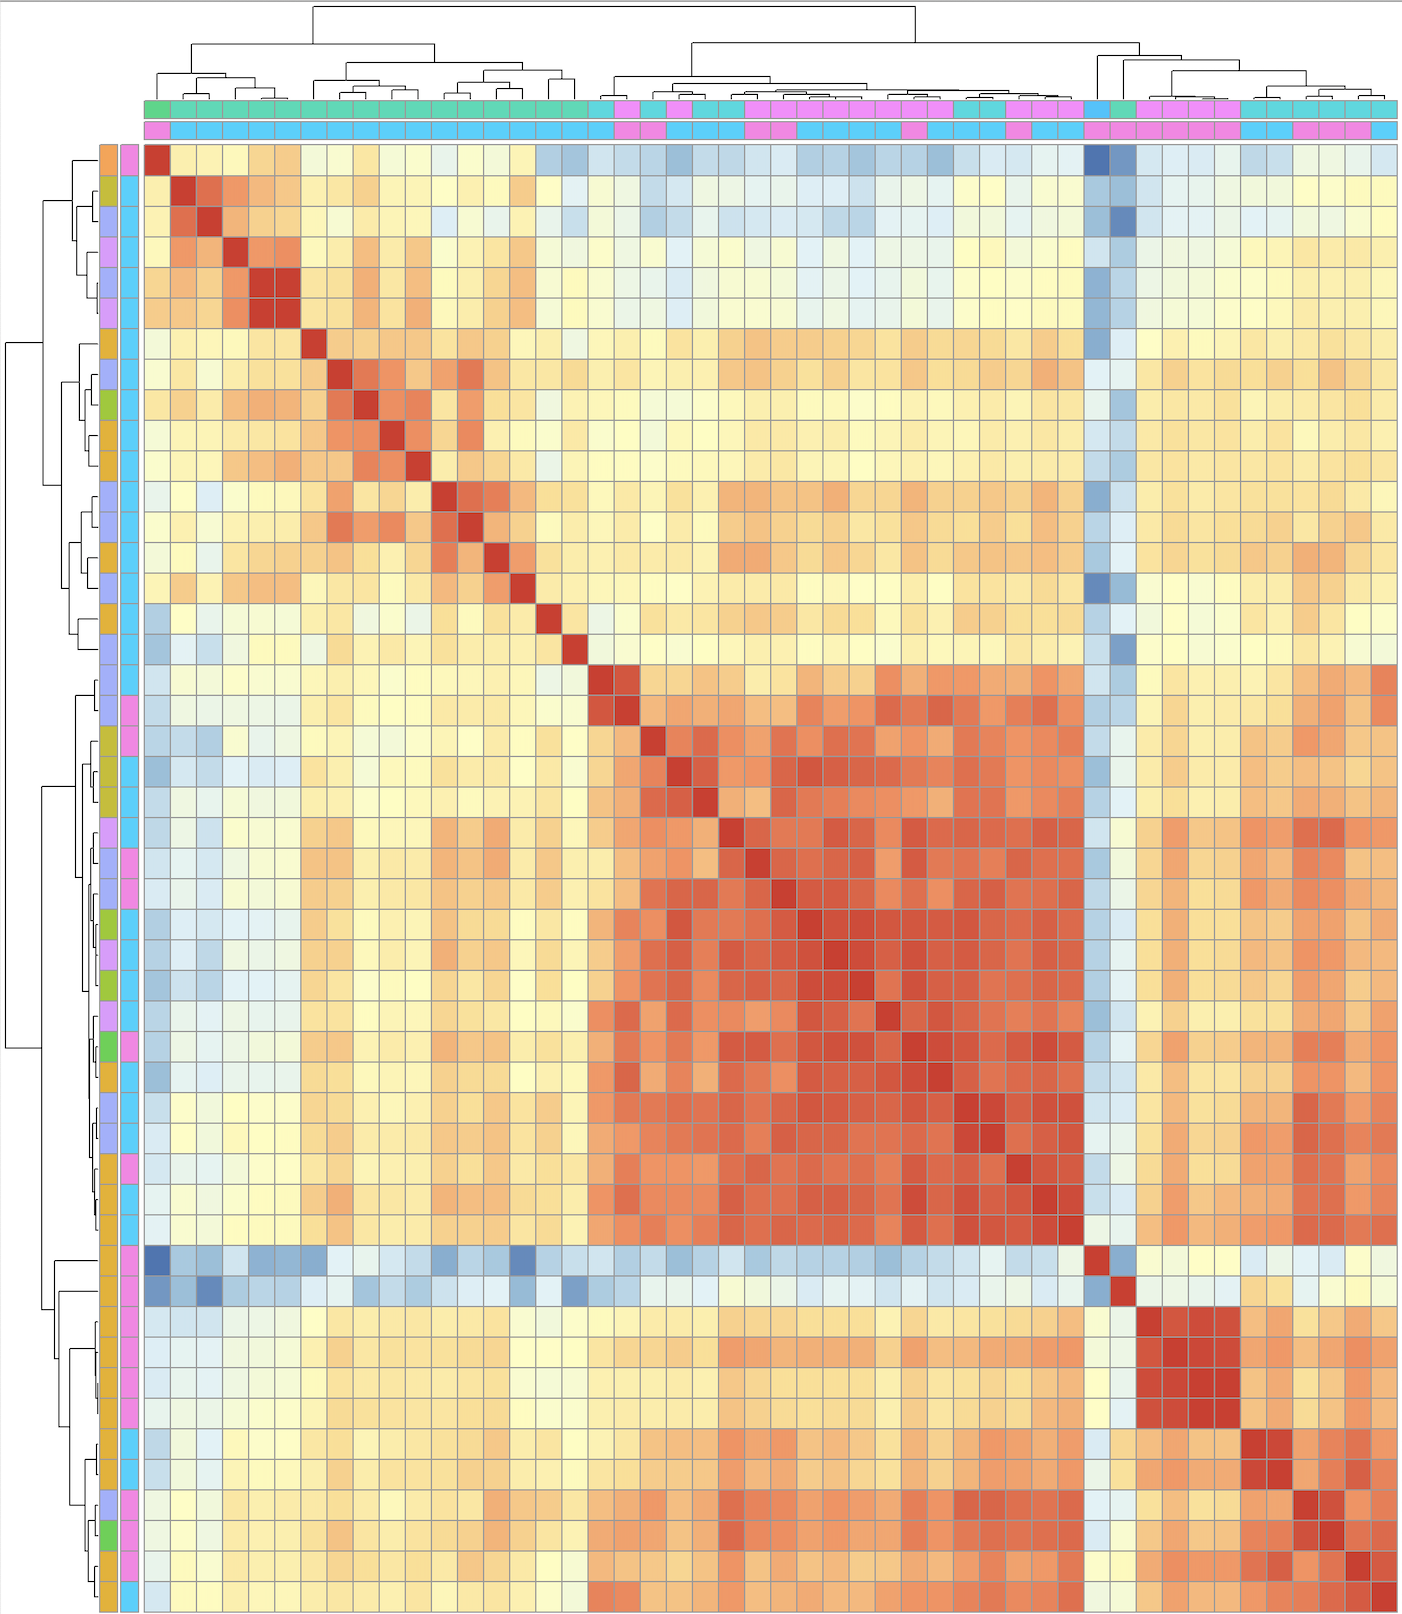
Project 3: Cluster Membership
Scope: clustered 48 antigens into 4 groups.
- Fitted standardized data across time point and treatment groups.
- Applied hierarchical clustering algorithm with Ward’s minimum variance method to find compact, spherical clusters.
- Chose the best number of clusters by cutting the corresponding hierarchical tree based on their Pearson’s correlation.
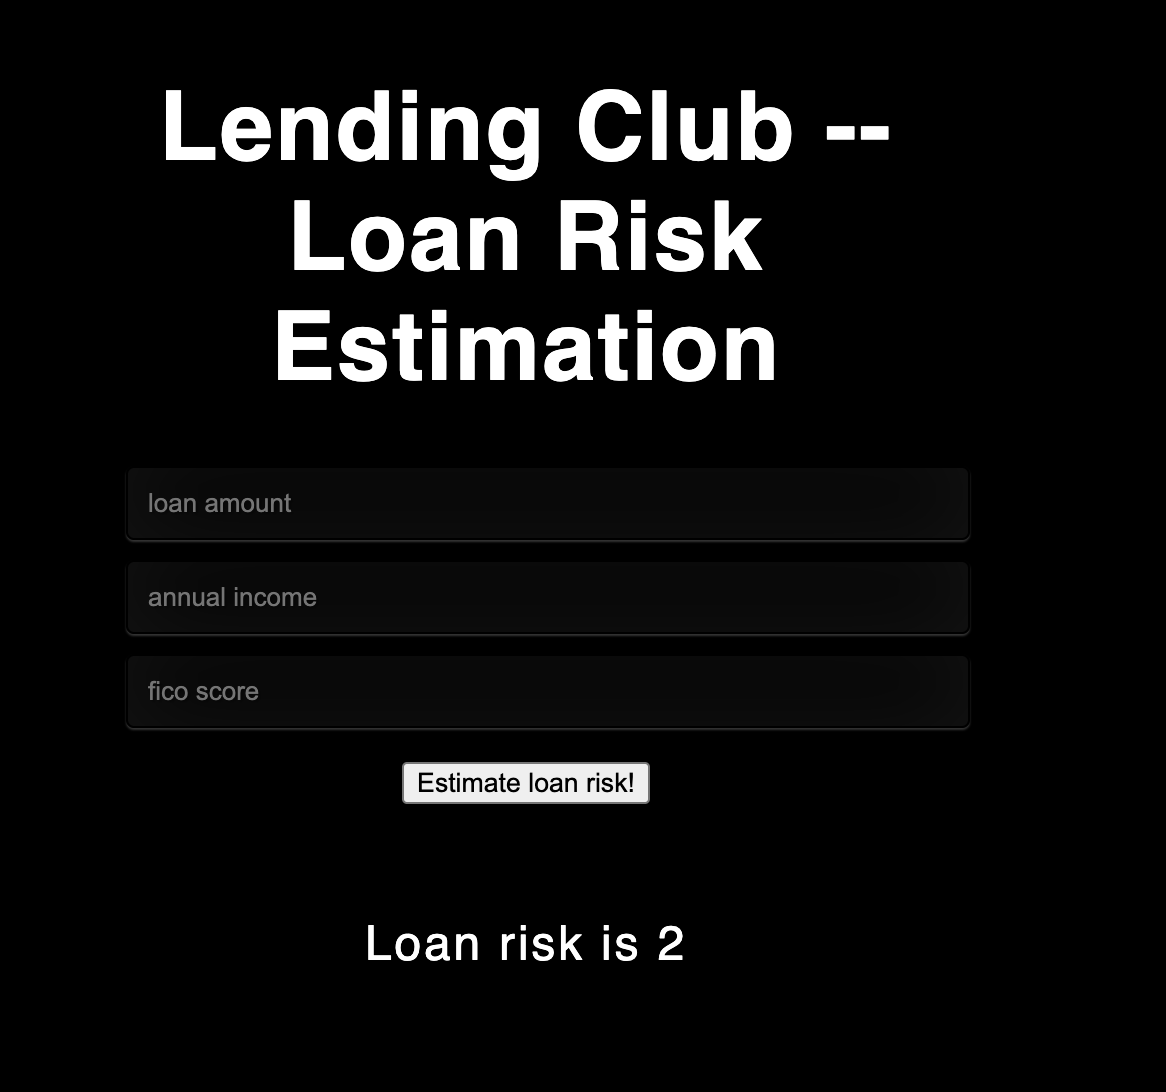
Project 4: Lending Club Loan Risk Prediction
Data size: 500k+; Data Source: Link
- Cleaned and processed the lending club open souce dataset (2019 Q1-Q4).
- Applied feature engineering to 150+ features, and revealed the top factors for loan risks.
- Trained Random Forest and Gradient Boosting to predict loan risks (average precision & recall > 75%)
- Created an interactive loan risk prediction using Flask API (below).